Redis is a popular open-source in-memory database which can also be used as a message broker. It can be scaled (lineraly) to handle large volumes and throughputs of an order of 50 million ops per second. Redis can be considered as a key-value store, but the uniqueness in its design approach is that various data structures like List, Set, ZSET, and Hyperloglog among others. Monitoring REDIS is a key requirement in production environments. In this blog, we outline the basic steps to monitor a REDIS cluster using Prometheus REDIS Metric Exporter, Prometheus and Grafana. Around 100 different metrics are generated by REDIS instance. A detailed list of these can be found here.
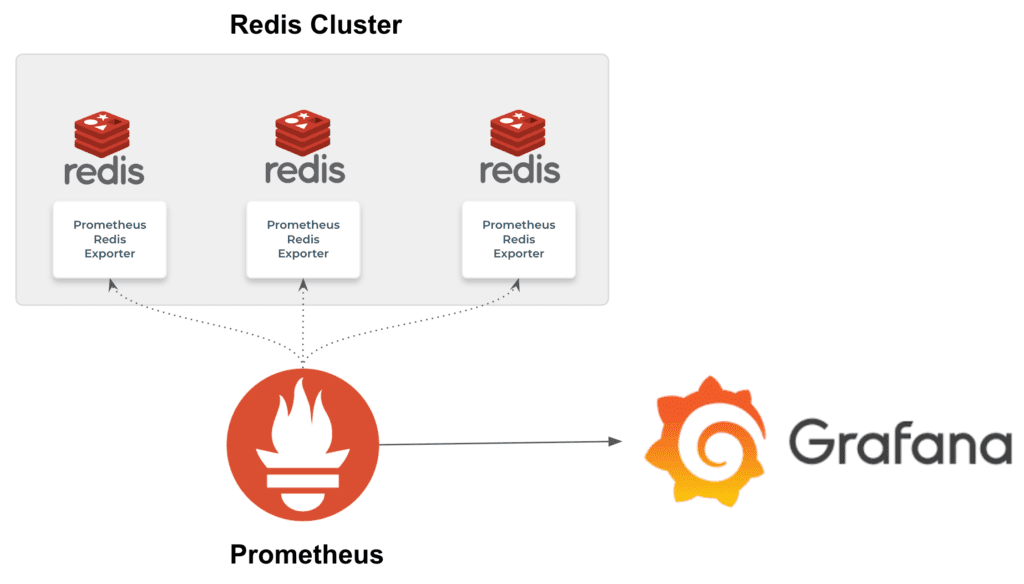
The diagram below shows a high-level archicture of the components

Installing Prometheus
Exporter Configuration
Prometheus REDIS exporter can be downloaded from https://github.com/oliver006/redis_exporter/releases. Optionally you can clone the repository https://github.com/oliver006/redis_exporter/ and follow the build operations mentioned in the README file. Once downloaded you can run the binary
/redis_exporter –redis.addr= [IP ADDRESS OF THE REDIS HOST] –redis.user [USERNAME] –redis.password [REDIS PASSWORD]
Other command line options can be seen within the README file of the redis_exporter. Once the redis_exporter starts and connects to the REDIS instance, it can capture the metrics being exposed by the REDIS instance. Thereafter, we can configure prometheus to scrape values from the redis_exporter by specifying the configurations in prometheus.yml as shown below:

scrape_configs: ## config for the multiple Redis targets that the exporter will scrape – job_name: ‘redis_exporter_targets’ static_configs: – targets: – redis://first-redis-host:6379 – redis://second-redis-host:6379 – redis://second-redis-host:6380 – redis://second-redis-host:6381 metrics_path: /scrape relabel_configs: – source_labels: [address] target_label: param_target – source_labels: [param_target] target_label: instance – target_label: address replacement: [REDIS-EXPORTER-HOSTNAME]:9121
## config for scraping the exporter itself
- job_name: 'redis_exporter'
  static_configs:
    - targets:
      - <<REDIS-EXPORTER-HOSTNAME>>:9121
The Redis instances are listed under targets, the Redis exporter hostname is configured via the last relabel_config rule.
Grafana Dashboards
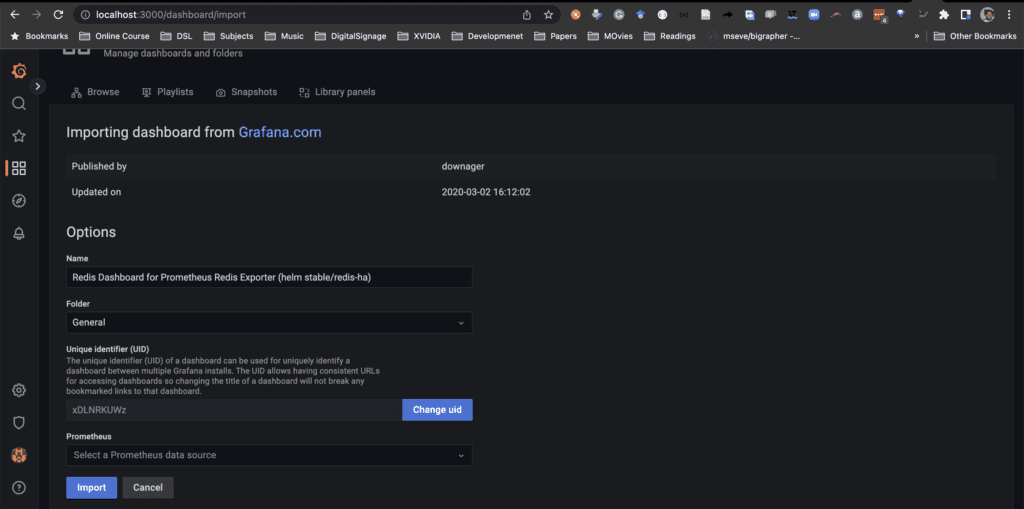
There are various dashboards available out of the box from the Grafana site [hhttps://grafana.com/grafana/dashboards/?search=REDIS], select the one which suits your monitoring requirements and copy its dashboard ID.
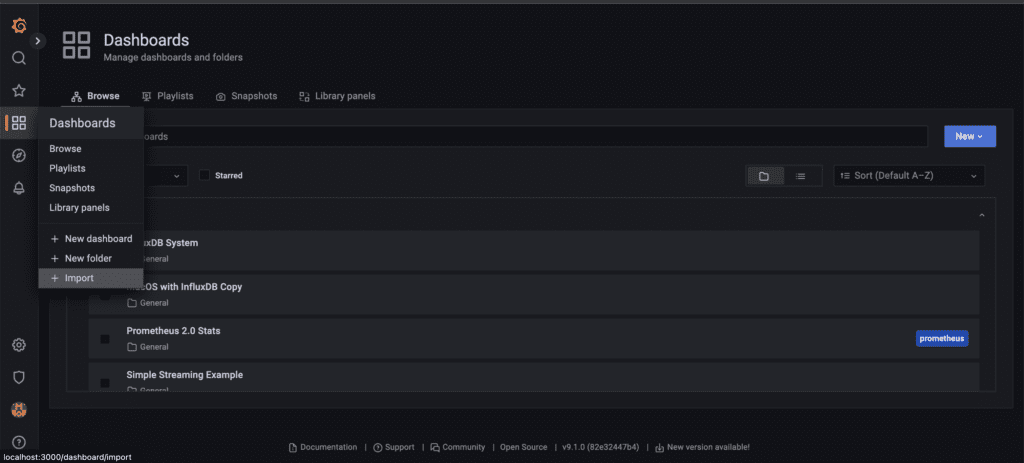
Inside Grafana you can import the dashboard using Import option as seen in the figures below:

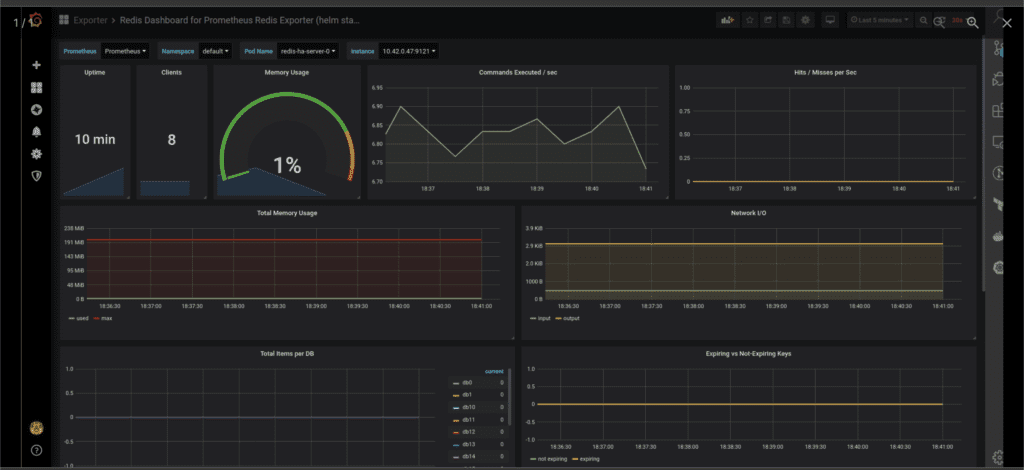
Once imported you can view the dashboard as shown in figure below and start monitoring your REDIS installation.


